Your weather station's barometric pressure reading is one of the most forecasting-useful numbers it produces — but only if you know how to read it. The absolute pressure value (29.92 inHg, 1013 hPa) tells you almost nothing by itself. What matters is how that number is changing over the last hour, the last three hours, and the last twelve hours. Pressure trends are the meteorological signal; pressure values are just the carrier.
This guide explains exactly what different pressure trends mean, what rates of change signal significant weather, how your station's pressure reading differs from what the airport reports (and why that's not a problem), and how to use your data for practical short-range forecasting that beats regional models at your specific location.
Absolute Pressure vs. Sea Level Pressure: The Calibration Step You Must Do
Raw barometric pressure decreases with altitude — the higher you are, the less atmosphere is above you, the lower the pressure. A station in Denver (elevation 5,280 ft) reads roughly 24.5 inHg when a coastal station reads 29.9 inHg, even when both locations have identical actual weather. This makes raw (station) pressure useless for comparing weather patterns across locations or comparing your reading to official forecasts.
Meteorologists solve this by reducing all pressure readings to sea level using a standard atmospheric formula. Your weather station app does this automatically once you enter your elevation correctly during setup. The sea-level pressure (also called "altimeter setting" or "QNH" in aviation) is what weather apps and forecasts report, and it's what you should configure your station to display.
Verify your elevation setting is accurate. Even 50 feet of elevation error introduces a noticeable offset. The formula is approximately 0.11 inHg per 100 feet of elevation. If your station elevation is set 200 feet too low, your sea-level pressure will read about 0.22 inHg too high compared to nearby official stations. Use a GPS app or a USGS topographic map to get your elevation to within 20–30 feet — not just your zip code's approximate elevation.
The Three Trend Categories That Matter
Falling Pressure
Falling pressure means a low pressure system is approaching or deepening. Low pressure systems are associated with rising air, cloud formation, and precipitation. The rate of fall matters more than the direction:
| Rate of Fall (3-hour change) | Meteorological Term | Typical Implication |
|---|---|---|
| Less than 0.06 inHg (2 hPa) | Steady / Slow fall | Gradual deterioration possible; watch the trend over 12 hours |
| 0.06–0.20 inHg (2–7 hPa) | Falling / Moderate fall | Active weather likely within 12–24 hours; clouds increasing, wind probably veering |
| 0.20–0.40 inHg (7–14 hPa) | Rapid fall | Significant storm system approaching; strong wind and precipitation likely within 6–12 hours |
| More than 0.40 inHg (14 hPa) in 3 hours | Very rapid / Explosive fall | Severe weather developing; this rate indicates bomb cyclogenesis or very intense low approaching |
The threshold that most mariners and experienced weather observers watch closely is a fall of 0.18 inHg (6 hPa) in 3 hours — this reliably signals an active frontal passage or intensifying low pressure system within the next 6–12 hours in most continental climates.
Rising Pressure
Rising pressure means high pressure is building — generally associated with descending air, cloud dissipation, and clearing skies. High pressure brings stable conditions but also the weather that follows a storm's passage. The pattern after a frontal passage is characteristic: sharp pressure fall as the front approaches, brief very low pressure at the center, then rapid rise as the cold high builds in behind the front.
Very rapid pressure rises (more than 0.20 inHg per 3 hours) behind a strong cold front are associated with the fastest-moving cold air masses and often produce the most intense post-frontal clearing and temperature drops. A rise this fast in the hours after a storm passes means conditions will improve quickly and dramatically.
Steady Pressure
Steady pressure (less than 0.03 inHg change over 3 hours) indicates a settled weather pattern. This doesn't necessarily mean clear skies — a persistent warm sector ahead of a stationary front can maintain steady moderate pressure while producing days of steady rain — but it means no rapid change is occurring in the atmospheric mass above you.
The 24-Hour Pressure Pattern: Your Baseline
Before you can interpret trends, you need to know about the atmospheric tidal oscillation — a natural pressure cycle that happens every day regardless of weather. Atmospheric pressure peaks twice a day (roughly 10 AM and 10 PM local time) and troughs twice a day (roughly 4 AM and 4 PM local time) due to thermal effects in the upper atmosphere. This cycle has an amplitude of about 0.04–0.06 inHg (1–2 hPa) in mid-latitudes.
This matters because it means a 0.03 inHg pressure fall at 3 PM is almost certainly the afternoon tidal trough, not an approaching storm. A 0.03 inHg rise at 8 PM is the evening tidal peak, not building high pressure. When evaluating trends, always account for this diurnal cycle by comparing pressure at the same time the previous day, or by looking at 12-hour and 24-hour trends rather than 3-hour changes during known tidal phase shifts.
Reading the Graph: What Your Station's Pressure History Shows
Every major weather station platform (ecowitt.net, ambientweather.net, Weather Underground) displays a pressure history graph. Learning to read these graphs quickly gives you much better situational awareness than any single pressure number.
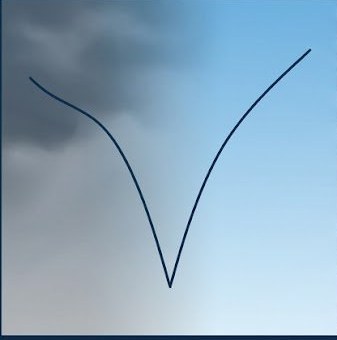
The classic frontal passage signature looks like this on your graph: gradual pressure fall over 12–24 hours → accelerating fall over the last few hours → pressure minimum → sharp rise as the cold front passes → continued moderate rise for 12–24 hours afterward. The sharper and faster this "V" shape, the more intense the frontal system was.
A warm frontal approach looks different: very gradual, steady pressure fall over 24–48 hours with little acceleration. The low-pressure center passes well to the north, and the transition is slow. You get increasing clouds and steady or light rain over a long period rather than a sharp frontal line.
A pre-storm pressure spike — where pressure actually rises briefly before falling ahead of a major storm — occasionally appears with very intense low-pressure systems. This is the dry slot and high-pressure ridge ahead of a powerful cyclone's warm sector. If you see a 6–8 hour pressure rise followed by rapid fall, it can precede a particularly active frontal passage.
Using Pressure for Practical Home Forecasting
Your station's pressure data, combined with current sky observations, gives you genuinely useful 6–12 hour forecasting ability that regional models can't match for your specific location. The key skill is learning your local pressure signatures for the weather patterns common to your region:
- Great Plains: Watch for rapid pressure falls preceding convective lines (squall lines, derechos). A 0.15–0.20 inHg fall in 3 hours in July means a convective complex may arrive within 6 hours. Combine with rising dew point (use the dew point guide — see dew point explained) to assess convective potential.
- Northeast US: Nor'easters show characteristic steady pressure falls over 24–36 hours before rapid intensification. The rate of fall in the 12 hours before predicted arrival distinguishes a 3-inch snowstorm from a 12-inch one.
- Pacific Coast: Atmospheric rivers show as sustained moderate pressure falls over 24–48 hours. The lowest pressure value during the system correlates roughly with precipitation intensity at your location.
- Gulf Coast / Southeast: Tropical systems show extremely rapid pressure falls once they approach. Any pressure fall exceeding 0.30 inHg in 3 hours during hurricane season warrants immediate severe weather awareness.
What "Normal" Pressure Is at Your Location
The "standard atmosphere" of 29.92 inHg (1013.25 hPa) is the average sea-level pressure. Your local annual average may differ by 0.1–0.3 inHg depending on your climate. High-pressure-dominated climates (interior West) average slightly above 29.92; low-pressure-dominated climates (Pacific Northwest in winter) average slightly below. Your station's long-term history will reveal your local climatological normal, which makes interpreting anomalies more precise.
After 6 months of data, you'll start to see patterns that regional climatological averages don't capture — the exact pressure signature of your local sea breeze, the timing of afternoon thermal low development in summer, and the pressure plateau that accompanies your region's most common precipitation-producing pattern. This local pattern recognition is what makes a personal weather station genuinely useful for forecasting, not just data logging.
Frequently Asked Questions
Both may be "correct" — they're measuring at different elevations. If your station is calibrated at your elevation and the weather app is reporting sea-level pressure for the nearest airport, they should match within 0.05–0.10 inHg. If the difference is larger, check your elevation setting in your station's app. Also note that weather apps sometimes lag official station updates by 15–30 minutes, so a difference during a rapidly changing period may just be a timing offset.
The diurnal tidal oscillation described in this article is the most common cause — it's completely normal and not weather-related. Verify by checking whether the drops and rises occur at consistent times (typically around 4 AM and 4 PM troughs, 10 AM and 10 PM peaks). If the pattern is timed differently or varies significantly in amplitude day to day, you may have a temperature compensation issue in your barometric sensor — some sensors are sensitive to rapid temperature changes that occur with sunrise/sunset and require a brief warm-up period after power cycling.
Use 3 hours. The meteorological standard for pressure tendency (the change used to determine forecast symbols on weather maps) is the 3-hour change. One-hour tendencies are noisy and easily dominated by the diurnal oscillation and brief sensor fluctuations. Most station consoles and apps use 3 hours by default; verify this in your station's settings. Some Ecowitt consoles have a 1-hour tendency option — switch it to 3 hours if available for better forecast arrow accuracy.
For personal, non-flight-critical reference only. Official aviation altimeter settings (QNH) must come from certified reporting stations (ASOS, AWOS) and are updated every hour or more frequently. Your home station's altimeter setting can serve as a reality check or for general situational awareness, but should never be used for actual aircraft altimeter setting. The legal and safety requirements for aviation weather are strict for good reason.